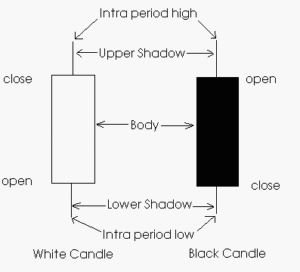
Candlestick terms: Bodies and Shadows
Being an important component of technical analysis, candlestick chart patterns (or terms) have a considerable popularity among forex traders. Users can see chart modules represented as bars, lines, or candlesticks.

There are two parts of the candle: its body and the shadows. The open and close prices of the set period are represented by the candlestick’s body. In case the open price exceeds the closing one, the body of the candle turns black and the opposite situation gives the white body. High and low trading prices within the period are reflected by the shadows of the candle. The most common periods used in candlestick charting are 5 minutes, 15 minutes, one hour, daily and weekly. Vast trading prices within the period are represented by the long shadows whether short shadows explain that the trading was held close to closing and opening prices.
Long and Short Bodies
In case the candlestick body is white and prolonged then the strong pressure of buyers is seen. The closing exceeds the opening as much, as long the candlestick body is. This situation is explained by the aggressive buyers’ trading that makes closing price go much higher than the opening is. Long white candlestick usually represents the bullish market though the situation worth watching in wider technical frames. A long white body may be the point of a possible turning point as well as a level of support in case of declining extended. A high aggression of the buyers following the long uptrend may cause an excessive bullishness.
A strong influence of the sellers is seen when the candlestick turns long and black. The length of the black candlestick depends on how far the close price is below the open price. This indicates the aggression of the sellers that causes a considerable prices reduction. A long black candlestick following the long uptrend may forecast the turning point as well as the resistance level that is to exist in future. A long black body following the long downtrend may show the panic of the participants as well as capitulation.
Marubozu Black and White long candlestick are even more important. There are no shadows in these candlesticks. The high and low ones are derived out of the open or close stages.
Long and Short Shadows
The session heights are shown by the shadow on the top whether the one on the bottom describes the lows of the session. In case the trading was held not far from its open and close prices, the shadows are short. Long shadows say that trading was held in high range referring the session’s open and close price. In case the shadow on the top is long and the one on the bottom is short then we are supposed to think that the buying pressure is strong and they managed to raise the prices, but the sellers later made the prices go down to the low closing price, but its movement has formed a long upper shadow. The opposite situation (with long shadows on the bottom and short ones on the top) explains that the sellers managed to drive prices down while dominating the market, but the buyers forced the prices up back closer to the end of the session that has left a long shadow on the bottom of a candlestick.
Another situation worth describing is called spinning tops and occurs when the candlestick has long both upper and lower shadows along with the short body of the candlestick. While one long shadow is a sign of the reversal, the situation when both shadows are long indicates participants’ hesitation. Small body size, despite its color, describes that the price has moved slightly from the open price to the close one. Long shadows show an extreme activity of both buyers and sellers through the session. Prices fluctuation has been considerable within the period despite open and close are not far from each other.
A spinning top following the long uptrend (represented by a long white candlestick) may be the sign of the bulls’ weakness and possible inversion or interruption of the trend. In the opposite case a spinning top appearing after a long black candlestick, or decline, may show the bears’ weakness and forecast possible trend inversion or interruption as well.